////////////////
Share


I would like to take the opportunity to explain how big fishes/company directors setting up a honeypot to trap the small traders to pick up their unwanted shares. i will take DSCSOL as a real case study because today is the last day when they 'release' the final trap and i believe thousand if not million of victim traders fell into their intentionally designed trap.

Let's assume the big fishes have RM 300 000 of cash.

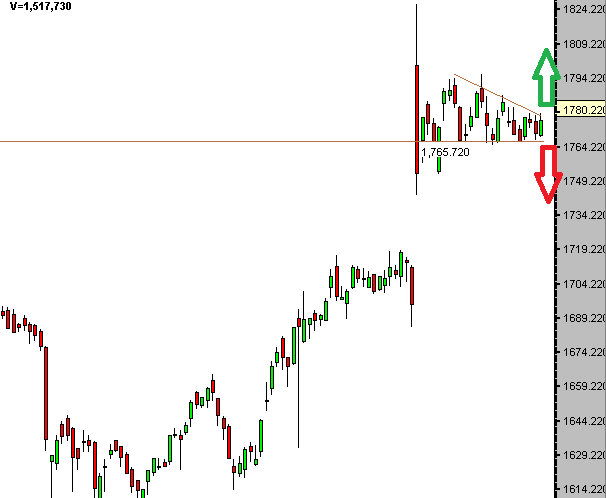
By referring the the chart above, during the consolidation or accumulation period, let's assume they have accumulated 1.1 millions of shares at an average price of RM0.09 which is equal to approx. RM100K.

Next, on 1 Oct 2013, the big fishes started using their remaining cash to push up the price to get attention from the public. From the first arrow till the second arrow they might only used a small portion of the cash to push up the price. Let's assume they used only RM50K to accumulate 454K of shares at an averaged price of 0.110.

At this moment, they have accumulated 1.554 million of shares at an averaged price of RM0.096525. 
( The calculation is Rm150K/1.554)

Next , on the second arrow till the last day, the big fishes push the price more aggressively and more and more traders coming in. The victims that fallen into this trap has helped to push the price even further making the big fishes who has accumulated at low price earning big chunk of paper profits now.

 Let's assume the big fishes have bought another 500K of shares at an averaged price of 0.3 which costs them RM150K

So the final shares they have accumulated were 1.554 million + 500K which is 2.054 million of shares. The new averaged price was RM300K/2.054m = RM0.0146. 

But the question is, why they choose to cash in their profit today? Because today , 28 Nov 2013 is their company Q3 quarterly report announcement date and they (as a directors) have already known they are making losses!

So, on the final day, they have earned enough and start disposing their shares. Let's assume they dispose all shares at an averaged price of RM0.40. Ermm....how much they have earned?

Amazingly , 2.054m X RM0.40 is RM821 600. 
After minus the cost , their net profit is RM521 600.

And don't forget i am just using a conservative calculation for you to understand easier. They might have accumulated more during the consolidation period :-)

Now the question is, if you have fallen into the trap today? What should you do? i personally think that it won't go up again anymore.

Here is the daily chart for 28 Nov 2013


Share


as you can see , Tgoffs is actually riding on an uptrend line. it has been touching this uptrend line for 3 times and it did rebound. As a result , i foresee Tgoffs will rebound tomorrow.

Share


In my previous post, i had a buy recommendation on Airasia and set a first target price at fibonnaci 50% level which is near RM3.00. It touched at RM2.960 and it did retrace. Unfortunately it formed a Shooting Star after touching this level. A lot of traders when seeing this Shooting Star they will start selling. As a result, Airasia was retraced quite heavily.

I think the selling pressure will end very soon. Besides that, Stochastic shows oversold signal already. So i will remain a Hold rating or average down if you think the coming quarterly report will be a big surprise.

Share


From the Chart, it looks like Pelikan is going to shoot up for the second wave. As i am writing this post, this morning the price has gone up to 0.700 coupled with big volume. Thus, i strongly believe the second wave is coming.

To justify my buy call, the technical analysis shows that Pelikan has found its support at 0.600. This zone is also near the 61.8% Fibonacci level.

Secondly, after the first wave ended on 27 Sept 2013, the volume was reducing. Thus, the recent price dropping was just minor profit taking. More to come!

Thirdly, Stochastic shows a oversold signal.

i would suggest to buy for short term.

Share

On 26 Sept 2013 and 17 October 2013 i have published two analysis reports on Airasia. I strongly suggested to buy in. Since then it has increased more than 12.5%.

The question now is can we buy at the current price or should we hold/sell for existing traders?


From my technical analysis , i notice Airasia has broken the uptrend tunnel. Thus , it will be very bullish. And it seem like has broken the 61.8% Fibonacci line too. As a result, Airasia price should be and will be heading to 50% Fibonacci line very soon.

However, both RSI and Stochastic has shown overbought signal. Thus , it may retreat a little bit before heading up. Thus, i would suggest to buy on any correction.

First  Target  Price : RM3.00

Second Target Price : RM3.120

Share

i wrote an analysis report on Airasia on 26 September 2013 and i strongly suggested a buy recommendation at RM2.560 at the time of the article published. It has since up near 10% as of today at RM2.810.

When i am writing this post , 10:40 am , the price is at RM2.810 and this is actually a breakout of the up trend tunnel. As a result, if the price manage to hold at or above this price by end of today, there will be a strong buy call again on Airasia and the near term target price should be RM3.00.


* This is solely based on Technical Analysis , no sentiment news is taken into consideration.

Share

I notice Oldtown is on a down trend for mid-term. I would not suggest to buy Oldtown for this moment until a breakout from this down trend tunnel happens which is when the price stand above 2.680.

Oldtown's PE is above 20 which is relatively high for me. You may Hold for this stock if you are a long term investor as Oldtown is expanding their business oversea aggressively.


Share


As you can see, Airasia looks like riding on an uptrend line or a tunnel. It has been touching the line for 3 times and it did rebound. Today is the 4th time, i guess it will rebound too. and the down trend volume for the pass 4 days is relatively low and thus a shoot up soon is possible.

Furthermore , Airasia announced that they've received the GRANT OF INITIAL NO OBJECTION CERTIFICATE TO AIRASIA (INDIA) PVT LT which i believe is somehow a positive catalyst to move up the price.

Risk : If the Ringgit continues depreciating , it will hurt Airasia  T.T

Share


Strong support line at 2.680. Both RSI And Stochastic also showing oversold.

Coupled with yesterday's quarterly report showing profit has increased 9%. I believe it's a good buy for Dialog now!.

Share

Inari still in a beautiful uptrend support. Seem like it's very hard to break 0.860.


Share

Very beautiful uptrend support line for Inari. A good growth company share price should grow following an uptrend support line. and this is it!! Couple with a near oversold signal by stochastic , i believe Inari will not go below 0.850 , if it was broken, it should rebound quickly.


In addition, i did a weekly chart analysis for Inari a couple days ago and spotted a hammer which also indicates a bullish is coming. The article can be found here :

http://moneynology.blogspot.com/2013/08/inari-amertron-technical-analysis-13.html


Share

Hammer spotted! This indicates that the bulls are strengthening . This week gonna be a bullish week if no bad market sentiment..


Share

Inari's uptrend still Intact. In fact , it shows a very good buying signal. Next monday and tuesday should be shooting up. Inari-wa showed a Doji which increase the probability of shooting up tomorrow.


Share

According to the charting below, it seem like Inari has gone into a tunnel zone, we can't 100% sure for the moments but it looks like yes.

How long will the tunnel last?
An uptrend tunnel is a bullish sign where the price will grow within the tunnel. The tunnel could last very long sometime. Example of a beautiful tunnel appears in Oldtown :

Oldtown


Share

HaiO has shown a beautiful Ascending Breakout today. It's just started, still long way to shoot up. Rm3.00 shouldn't be a problem

Perfect!

Share

OK, the ascending triangle breakout is triggered. But the volume is not very convincing. Thus, tomorrow might or might not be shooting up. However,even it does not shoot up tomorrow,  high possibility that it will retrace a little bit (will not break 0.560) the following day or next week and then only confirm a real ascending triangle breakout and we can ride on the uptrend.


Share

If tomorrow NTPM is able to break 0.560 coupled with a high volume then an ascending triangle breakout is triggered. With a strong fundamental background by NTPM, the bullish after the breakout will be strong!.

Ascending Triangle formed!


Share

Share

Share


小故事,大启发:

许多年前,有一个美国老年人,他在路旁开了一家小吃店。当时正是经济不景气的年头。那个老人眼力不好,又几乎是个聋子。那老人的运气好,这里说他运气好,是因为他眼力不好,所以不能看报章;耳朵有重听,很难从朋友或收音机看听外面的情况。对外面的情况,他都不能去了解。

因为他并不晓得经济不景气有多严重,做事照旧很起劲。他把小店的门面油漆得漂漂亮亮,在路边竖起宣传的招牌,让人老远可以闻香下车,他店里预备的货色价廉物美,味道很好,吸引了很多外地来的客人到他的店去用餐,生意蒸蒸日上,一踏进他的店都不觉得像是在经济萧条的生活。

老人是个十分勤奋的人,赚了钱把他的儿子送到大学去读书。那儿子在学校中选了经济学系,他对于整个美国经济的惨况了如指掌。那年过圣诞节,他回家度假去。他看到店中业务仍然很兴旺,就对他父亲说:“爸爸,这地方有点不对劲。你不应该有这么好的生意呀,瞧您的兴致这样好,仿佛外面并没有经济不景气这回事一样。”

于是,他把经济萧条的前因后果仔细地讲解给他的父亲听,并且说全美国的人都在拼命地节省、紧缩;每个人都不敢去消费,货币的流通量逐渐下滑。

这时,那个老人便受到了消极思想的影响,他对他自己说:既然如此,我今年最好也不再油漆门面了。外面闹恐慌,我还是省下一点钱来最好。三明治的肉馅应该缩小一点,饮料应该缩小一点,面包应该切成更小块一点。再来,既然人人都没有钱,我又何必在路边做招牌来吸引顾客呢?还是把做招牌的钱省下来算了吧!

他把之前说有积极性的努力都停止了下来。结果呢?生意果然一落千丈。当那位大学生在假期又回到家时,父亲对他说:“儿子呀,我要谢谢你告诉我关于经济不景气的消息。那是千真万确的事,连我的店也感受到了,儿啊,受大学教育实在太有用了!”

总结:这样的故事,带来了什么结论?如果这个老人不听专家的话,光凭他的努力和拼劲,店里的生意会受到经济不景气的影响吗?不会,可是他偏偏因不景气的消极思想所影响,放弃继续为店里的生意奋斗。

观点: 我们在现实生活中也一样,很多人因为专家的一句话而改变了当初的决定。往往都相信专家所说的一切都是对的,而我们所想的都是错的。笔者在这里不是要贬低专家的专业知识,而是想奉劝大家应该有独立的思考方式,不要盲目地跟从专家的每一句话。有些专家因自身的利益而发放假消息也说不定。专家所说的话可以当作参考,再理性分析当中的内容是否属实,才来做决定。透过独立思考的观念,进一步内观与自省,重新看待自我生命的价值。

Share


It's a beautiful breakout. However, there is no spike in volume, thus, it's not very convincing though. But i personally feel it's a bullish week.

Share

The recent KLCI Market is very flat , and  if you open the chart to see, you will notice that it's actually contracting to form a Symmetrical Triangle or Descending Triangle. Please look at the screen shot below :


it shows a symmetrical triangle which mean a serious breakout is coming very soon
This is a descending Triangle , normally if an up trend form a descending triangle, it will breakup upward.

I believe the index has contracted enough  and the volume also reduced gradually already. By next week we should be able to see a breakout. If it breaks upward. it gonna hit at least 1809 points. Huat ar!


Share


Share


Share


// extra code Protected by Copyscape Duplicate Content Software //end here